The problem
Every backend ends up needing the same four things
Once you have more than one backend service, you end up rebuilding the same stuff in front of all of them: something that checks API keys, something that stops one client from hammering you, something that routes a path to the right service, and something that tells you what just happened when a request fails. Most people either pay for a managed gateway or wire this into every service separately. I wanted to build the thing that sits in front and does all four, from scratch, in Go, so I actually understood what a reverse proxy and a rate limiter are doing under the hood instead of just configuring someone else's.
Conduit is that gateway. It sits between clients and your backend services, checks an API key, enforces a per-key rate limit, forwards the request to the right upstream, and logs it, all before your actual service code ever sees the request. A Next.js dashboard on top shows the traffic, latency, and error rate as it happens.
Architecture
Two planes, one process
There are two ports doing very different jobs. Port 8080 is the data plane, the actual proxied traffic, authenticated per request with a client's API key. Port 8081 is the control plane, the admin REST API the dashboard calls to manage keys and routes, gated by a single bearer token. Keeping them separate means a bug in the admin API can't accidentally let someone skip auth on real traffic, and vice versa. In production they actually run on the same port (Render/Fly only expose one), but the middleware chains stay logically separate.
Every request through the data plane goes through the same chain in the same order: recovery (catches panics so one bad request can't crash the process), logger (starts the timer), auth (hashes the key and checks it against Postgres), rate limit (sliding window in Redis), then the router, which matches the longest path prefix and hands off to a reverse proxy wrapped in a circuit breaker.
How it works
Rate limiting has to be atomic, not just fast
The rate limiter uses a sliding window over a Redis sorted set, one per API key, where each member is a request timestamp. A naive version would run one command to count requests and a second to record the new one, but that's a race: two requests arriving in the same millisecond can both read the count before either writes, and both get let through even if only one should have. So the whole check-and-record happens in one Lua script executed atomically inside Redis. Trim anything older than the window, count what's left, and only add the new entry if it's still under the limit.
If Redis itself is unreachable, the limiter fails open (it lets the request through and just logs the error) instead of taking the whole gateway down over a rate limit check. I went back and forth on that. Fail closed is safer in theory, but it means a Redis blip turns into a total outage for every client, which felt like the wrong trade for what a rate limiter is actually protecting against.
How it works
A circuit breaker per upstream, config reload without a restart
Each upstream gets its own circuit breaker (via sony/gobreaker), plugged in at the transport level so httputil.ReverseProxy doesn't need to know it exists. Five consecutive failures trips it open, and for 60 seconds after that, requests to that upstream fail instantly with a 503 instead of hanging on a dead connection. One trial request gets through in the half-open state to check if the upstream recovered.
Routes live in gateway.yaml on first boot (they seed Postgres, which becomes the real source of truth after that), and changing them through the admin API or the config file triggers a live reload. The router itself sits behind an RWMutex, so a reload swaps the whole route table in one atomic write while in-flight requests keep reading the old slice they already grabbed. Nothing gets torn mid-request. The file watcher watches the directory, not the file itself, because editors and atomic saves replace the file's inode on write, which would silently break a watch on the original file handle.
What broke
Two small bugs from actually deploying it
Bug 1 — the gateway ignored Render's assigned port
Locally I always ran the gateway on 8080 via GATEWAY_PORT, so that's the only env var main.go read. Render doesn't let you pick your own port, it assigns one and sets PORT itself. The gateway happily bound to 8080 anyway, Render's health checks hit the port it actually assigned, got nothing, and the deploy just sat there looking dead.
// Render (and most PaaS providers) set PORT automatically.
// GATEWAY_PORT overrides it; fall back to PORT, then 8080.
port := getEnv("GATEWAY_PORT", getEnv("PORT", "8080"))
adminPort := getEnv("ADMIN_PORT", port) // default: same port (single-port mode)
While I was in there I also collapsed the admin port to default to the same port as the data port, since Render only exposes one port per service anyway. Locally with both env vars set, it still runs as two separate servers like the diagram above shows.
Bug 2 — static export choked on useSearchParams
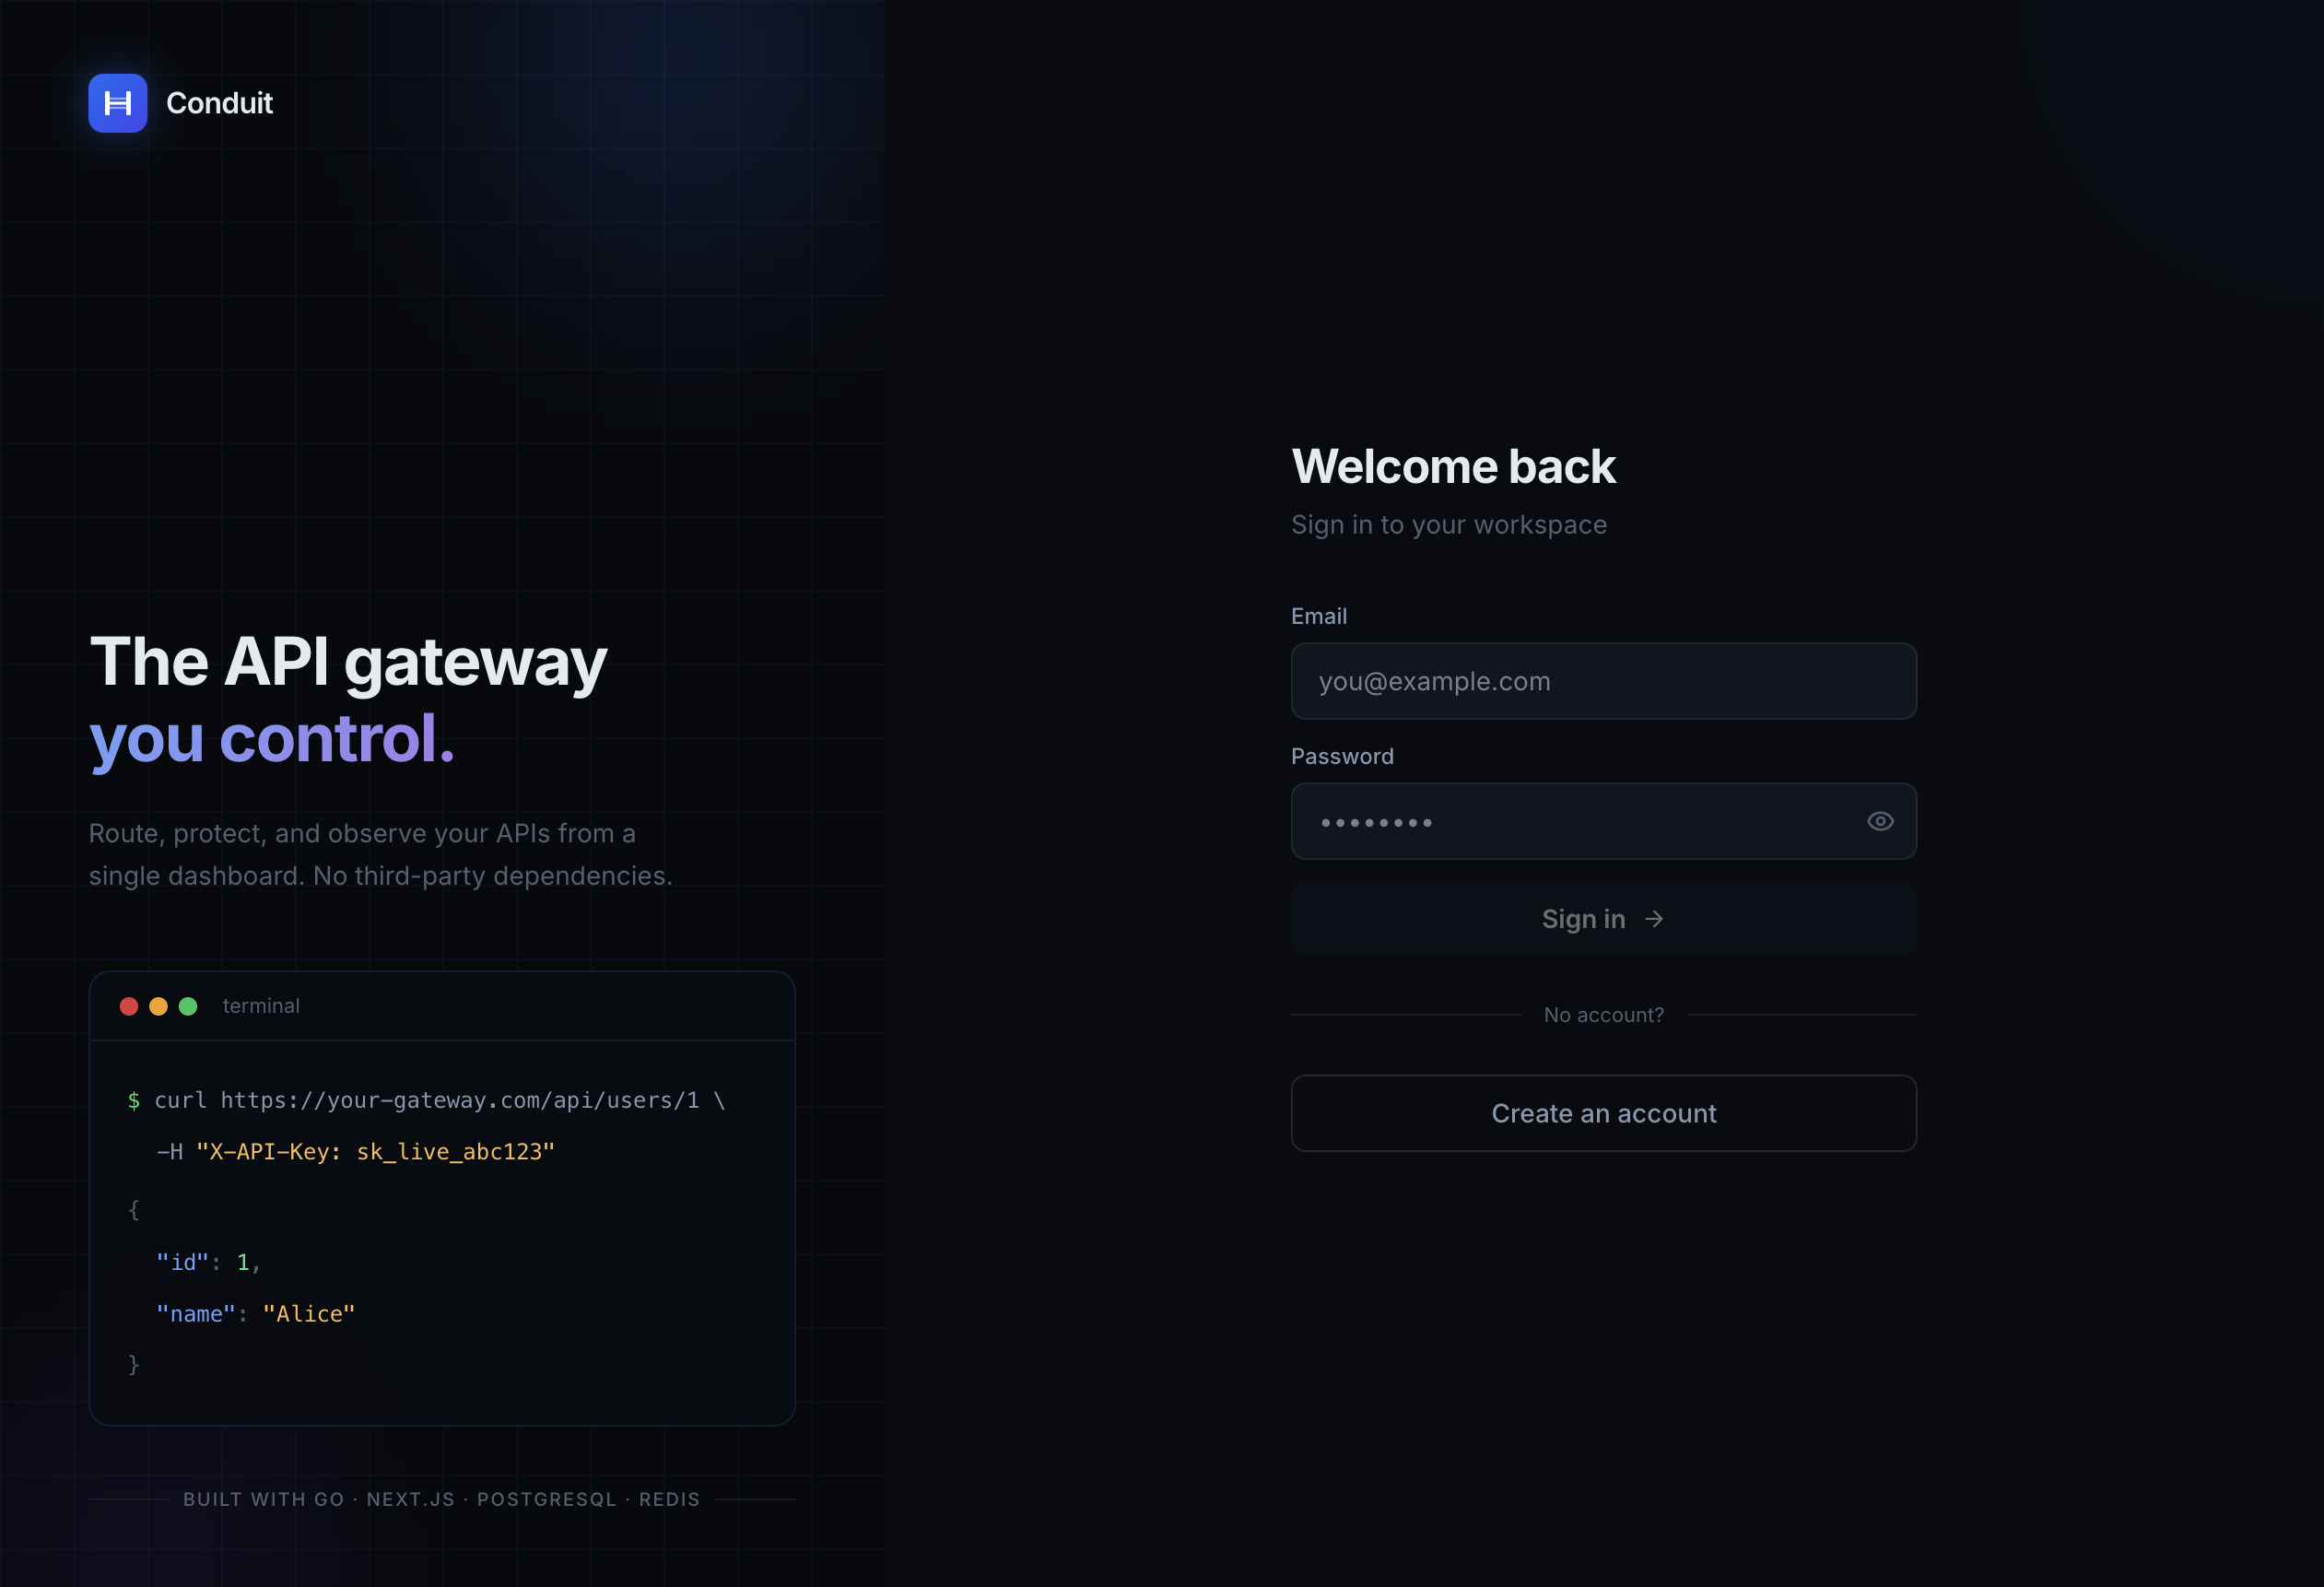
The sign-in page reads a next query param so it knows where to redirect after login, using Next's useSearchParams. That works fine in dev. The production build failed because Next needs any component reading search params to sit inside a Suspense boundary so it can bail out to a fallback during static prerendering instead of erroring.
export default function SignInPage() {
  return (
    <Suspense>
      <SignInForm />
    </Suspense>
  );
}

function SignInForm() {
  const params = useSearchParams();
  const next = params.get("next") ?? "/dashboard";
  // ...
}
Small fix once I knew what it was, but it cost me a confused fifteen minutes reading a build error that didn't obviously point at the sign-in page at all.
Design decision
Logging can't sit on the request's hot path
Every request needs to get logged (method, path, status, latency, which key, whether it got rate limited), but a database write on every single request means a slow Postgres write turns into slow proxying for the client, which defeats the point of a gateway that is supposed to be the fast, boring part of the stack. So the logger middleware doesn't write to Postgres itself. It hands a finished request off to a buffered channel, and a background worker drains that channel and does the actual insert. If the buffer fills up (database is slow, or down), new log rows just get dropped with a warning instead of blocking traffic.
One thing I haven't gone back to harden: that buffer is 1000 entries and picked without any real load testing behind it. Under genuinely heavy traffic with a struggling database, I'd be silently losing logs past that point, and I don't have visibility into how often the buffer actually fills beyond the one warning line in the logs.